
ONO considers global warming and other climate changes to be a major threat to people's health and recognizes them as important issues that affect the continuity of our business activities. For these reasons, the Environment Management Committee, whose activities cover the entire company, and the Carbon Neutrality Sub-Committee, which was established under it, take the initiative to engage in various activities to achieve a decarbonized society.
Risks and opportunities related to climate change are investigated under the leadership of the Environment Management Committee and the TCFD Working Group. They identify, analyze, and evaluate risks and opportunities that may have an impact on our business. For more details, please refer to our disclosure based on the TCFD Recommendation.
We are moving ahead with activities to achieve our medium- to long-term environmental targets.
| Our medium- to long-term environmental targets | Targets and results for FY2024 | |
|---|---|---|
| Greenhouse Gas Emissions (Scope 1+2) |
|
|
| Renewable Energy Rate in purchased electricity |
|
|
| Greenhouse Gas Emissions (Scope 3) |
|
|
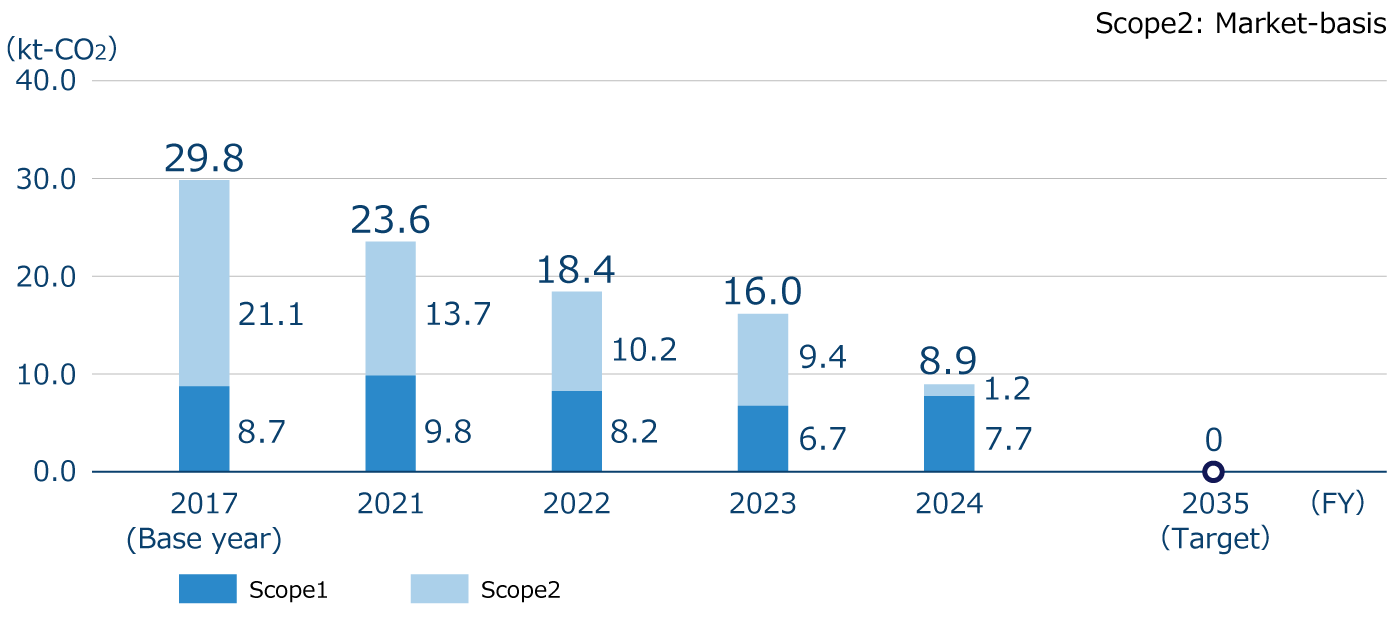
In FY2024, we achieved all of the fiscal year targets we set for achieving our medium- to long-term targets. Scope 1+2 greenhouse gas (GHG) emissions do not include the amount of CO2 offset through the use of voluntary credits (carbon neutral city gas purchases). When reflecting the amount of CO2 offset by such credits, FY2024 Scope 1+2 GHG emissions would be 2.0kt-CO2, which is a 93.4% reduction compared to FY2017. Scope 3 emissions are calculated using the previous fiscal year's data, since the GHG emissions of our major suppliers and pharmaceutical wholesalers, which are used to calculate Categories 1 , 9 and 15, had not been published at the time of calculation.
Scope 1+2 Greenhouse gas emissions*1
Energy consumption
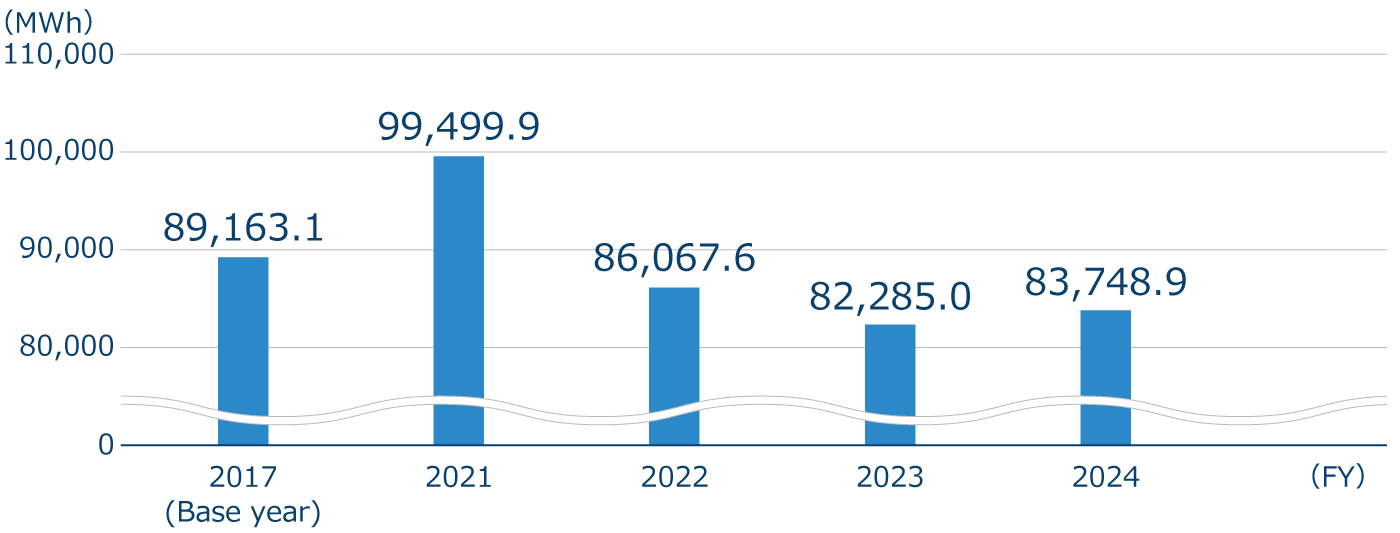
Electricity consumption and renewable energy utilization rate

We have established a policy for reducing GHG emissions based on recent energy market trends, costs, and projected changes in emission factors. Our priority measures are avoidance (creating systems that do not use energy), reduction (promoting energy conservation activities), substitution (switching to renewable energy sources, etc.), and offsetting (offsetting through the use of credits).
In addition, in order to promote low-carbon investments and climate change prevention measures, we have set our own internal price for carbon dioxide (CO2) emissions, introduced internal carbon pricing to be used for making investment decisions, and are promoting investments geared toward realizing a decarbonized society.
Scope 1+2 GHG emissions Reduction Roadmap


Demand response is positioned as an "optimization of electricity demand" under the Act on Rationalizing Energy Use and Shifting to Non-fossil Energy ("Revised Energy Conservation Act"). We have been striving to optimize the balance of demand and supply of electricity, in addition to electricity saving during regular time since FY2020 by saving and storing electricity (response) in response to the requests from power companies (demand).
At the Yamaguchi Plant, the system was modified to allow remote charging and discharging of NAS batteries for efficient demand response.

In accordance with the Act on Rational Use and Proper Management of Fluorocarbons (Fluorocarbon Emissions Control Act), we conduct activities, such as the identification of equipment subject to the Act, simple inspections/periodic inspections, generation of records, and calculations/reporting of leakage, etc. In FY2024, the calculated leakage of fluorocarbons was 0.6 ktons-CO2. We will continue to prevent leakage and promote the introduction of non-CFC (chlorofluorocarbon) and low-GWP (global-warming potential) equipment in view of the reduction of fluorocarbons emissions. At the same time, we promote the total abolition of devices using CFCs, which include ozone-depleting substances.
In order to develop more environmentally friendly manufacturing processes for active pharmaceutical ingredients (API), we adopt the Green Sustainable Chemistry (GSC) concept from the research and development stage. GSC is defined as "chemistry that is friendly to people and the environment and supports the development of a sustainable society." We use Process Mass Intensity* (PMI) as an indicator for evaluating the efficiency of API manufacturing, and are working to develop manufacturing processes for APIs in a manner that is conscious of reducing our impact on the environment from the research-and-development stage.
In “batch manufacturing system”, which is the mainstream in pharmaceutical manufacturing, each process is independent, and pharmaceuticals are manufactured by repeatedly isolating intermediate product during each process and moving on to the next process. In “continuous manufacturing system”, on the other hand, multiple processes are integrated into a single process by linking together compact equipment so that production is carried out continuously while each process is controlled for a fixed period of time. Continuous manufacturing therefore offers advantages such as more consistent quality as well as more efficient use of space. We are in the process of converting our wet granulation process from batch manufacturing to continuous manufacturing, and we expect that this transition will enable us to reduce the amount of raw materials (weight) required for development stage by approximately 13%* compared to the batch manufacturing system. In addition, due to space saving, the continuous manufacturing system is expected to be able to reduce facility-operation-related energy consumption by 24.3% compared to batch production. We intend to further expand the scope of continuous manufacturing to achieve further energy and raw material reductions.
Continuous manufacturing processes in which we are currently investigated


 Green Energy Certificate
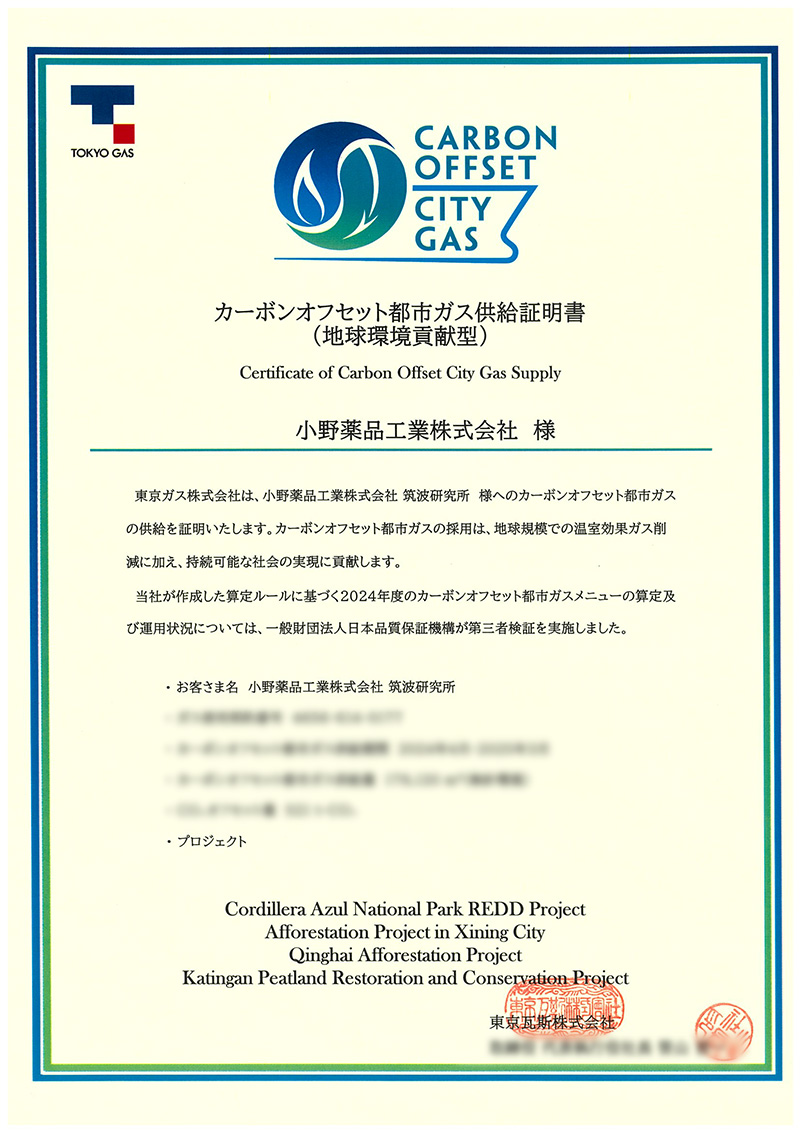 Certificate of Carbon offset city gas Supply
Collaboration with business partners is essential to reducing Scope 3 emissions. That is why we are working together with business partners in our supply chain to solve societal issues by promoting sustainability-related initiatives in areas such as the natural environment, human rights, and working conditions (For more details, please see here.).
In the logistics from our distribution centers to pharmaceutical wholesalers, we began joint transportation in compliance with GDP guidelines with four companies in January 2023. This initiative not only enhances the quality assurance of prescription pharmaceuticals, but also improves loading efficiency, leading to a reduction in the number of truck trips and expected CO2 emissions.
Furthermore, in FY2024, we launched an initiative to consolidate shipping days and reduce delivery frequency, with the aim of strengthening a sustainable logistics system and addressing the “2024 Logistics Problem*.” As a result, transportation efficiency has been further improved, contributing to work style reforms for workers, the stable retention of trucks and drivers, and further reductions in CO2 emissions.
As part of our GHG reduction efforts, we started using the “GreenEX” service in April 2025, which achieves virtually zero CO2 emissions for travel on the Tokaido, Sanyo, and Kyushu Shinkansen lines. “GreenEX” is a service that uses CO2-free electricity* to make CO2 emissions from Shinkansen travel virtually zero. By introducing this service, we can significantly reduce CO2 emissions from employee business trips. We will continue to promote decarbonization initiatives.