Water is an important resource for maintaining people's lives and health. Good quality water is essential for us to create innovative pharmaceuticals and ensure stable supply of these pharmaceuticals to patients. We are committed to minimizing the negative impacts of our operations on the global environment and achieving a sustainable water recycling society through efficient use of water, appropriately wastewater management, and enhanced stakeholder engagement.
As for water risks, the Environmental Management Committee and the Nature Positive Subcommittee (previously: Water Subcommittee) take the lead in identifying the risks that are considered to have negative impacts on our business and in considering countermeasures to mitigate those risks.
In addition, in FY2024 we reviewed water-related risks and disclosed information in line with the recommendations of the Task Force on Nature-related Financial Disclosures (TNFD). For more details, please see the page of our website titled “Information disclosure based on the TNFD recommendations.”
| Water stress | Sites |
|---|---|
| Low to medium risk | Yamaguchi Plant, Joto Pharmaceutical Product Development Center, Minase Research Institute |
| Medium to high risk | Fujiyama Plant, Tsukuba Research Institute |
| High or extremely high risk | Not applicable |
| Water shortage risk |
|
|---|---|
| Water pollution risk |
|
| Supply chain risk |
|
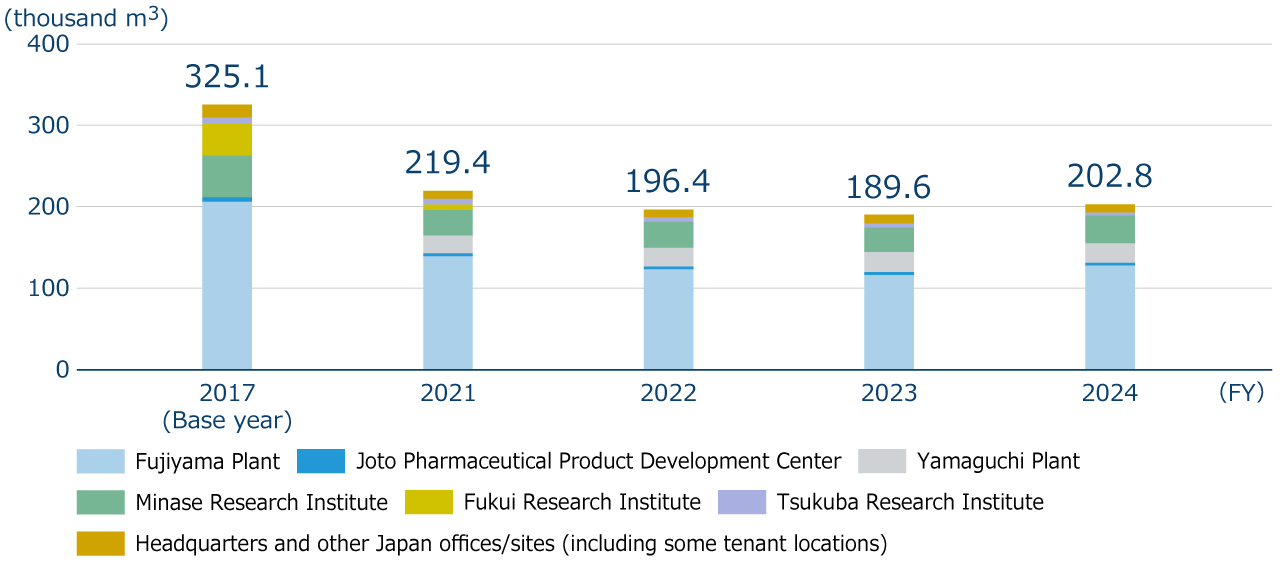
The total water intake amount in FY2024 was 202.8 thousand m3, an increase of13.2 thousand m3 reduction (increase rate: 7.0%) compared to FY2023. The main factors for the increase were the renewal of pharmaceutical water production equipment at the Fujiyama Plant and the use of water spraying to prevent dust dispersion during the demolition of the dai-4 research building at the Minase Research Institute. On the other hand, compared to the base year (FY2017), water intake in FY2024 was reduced by 122.3 thousand m3 (reduction rate: 37.6%), indicating steady progress in reducing water usage toward achieving our medium- to long-term environmental targets.
Specific initiatives to reduce water consumption have included improving the operation of equipment with high water consumption identified by installing ultrasonic flow meters at factories and research institutes (such as reviewing the water levels and optimizing sterilization processes in pharmaceutical and injection water tanks, stopping the spraying of water on air-cooling chillers and total heat exchangers, and changing the activation temperature settings for water spraying), reducing cooling water by recovering heat from hot wastewater tanks and high-temperature wastewater, upgrading to high-efficiency boilers, reusing condensate and cooling water from air conditioning systems, and conducting regular leak inspections. In addition, as a company-wide initiative, we have established a subcommittee on water to discuss new initiatives at each site to reduce water usage and to promote activities that raise employees’ awareness of water conservation.
Water intake (water resource consumption)
Water discharge
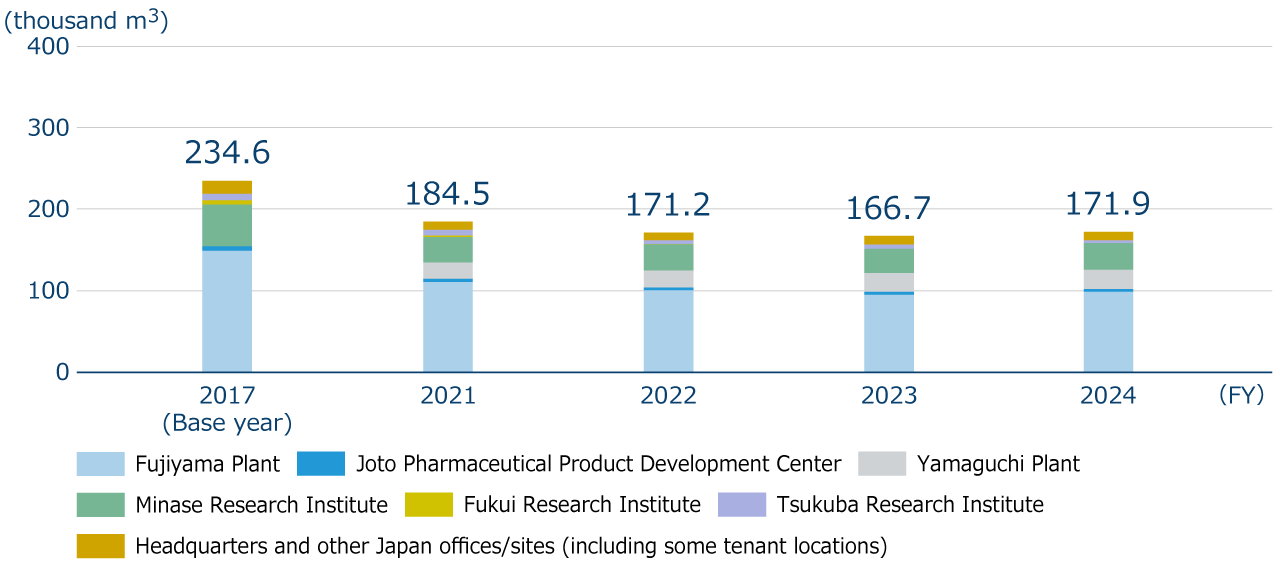
There is growing public concern about the ecosystem impacts of active pharmaceutical ingredients released into the environment. We are taking measures to prevent the release of active pharmaceutical ingredients, etc. into the environment during the manufacturing process of pharmaceuticals. For more details, please see the page of our website titled “Biodiversity.” Since FY2022, we have been conducting Whole Effluent Toxicity (WET) tests annually at our Fujiyama Plant, which is our major production center. In FY2024, the scope of WET tests was expanded to include the Yamaguchi Plant and the Tsukuba Research Institute, and we confirmed that there were no harmful effects on aquatic organism in the wastewater from the three facilities. By FY2025, we will establish a system to conduct WET tests annually at all our manufacturing plants and research institutes.
For active ingredients of development compounds and of pharmaceuticals, we will not only predict environmental hazards using in silico quantitative structure-activity relationship (QSAR) analysis but will also evaluate the effects on aquatic organisms, and these results will be disclosed through safety data sheets (SDS).
| Item | Scope | Unit | FY2021 | FY2022 | FY2023 | FY2024 |
|---|---|---|---|---|---|---|
| Number of breaches of legal obligation/regulatory violations | All operation sites | Cases | 0 | 0 | 0 | 0 |
| Amount of breach-/violation-related fines | All operation sites | Million yen | 0 | 0 | 0 | 0 |
| Environmental liabilities as of fiscal year-end | All operation sites | Million yen | 0 | 0 | 0 | 0 |
In FY2024, capital investment and facility maintenance costs (excluding personnel expenses) for preventing flooding caused by heavy rain and water pollution were 16 million yen and 87 million yen, respectively.
In the Water Security survey conducted by CDP, a global environmental non-profit organization, we have been selected “A List” company, the highest rating, for four consecutive years (FY2021 to FY2024).